The Hidden Costs Of Rapid Growth: A Crisis Of Drinking Water
Massachusetts is facing a water emergency. The Commonwealth has declared a Level 3 Critical Drought in the Central and Northeast Regions, with conditions worsening across several areas, escalating from Significant (Level 2) to Critical (Level 3) Drought Status. As the crisis deepens, the need for immediate action has never been more urgent.
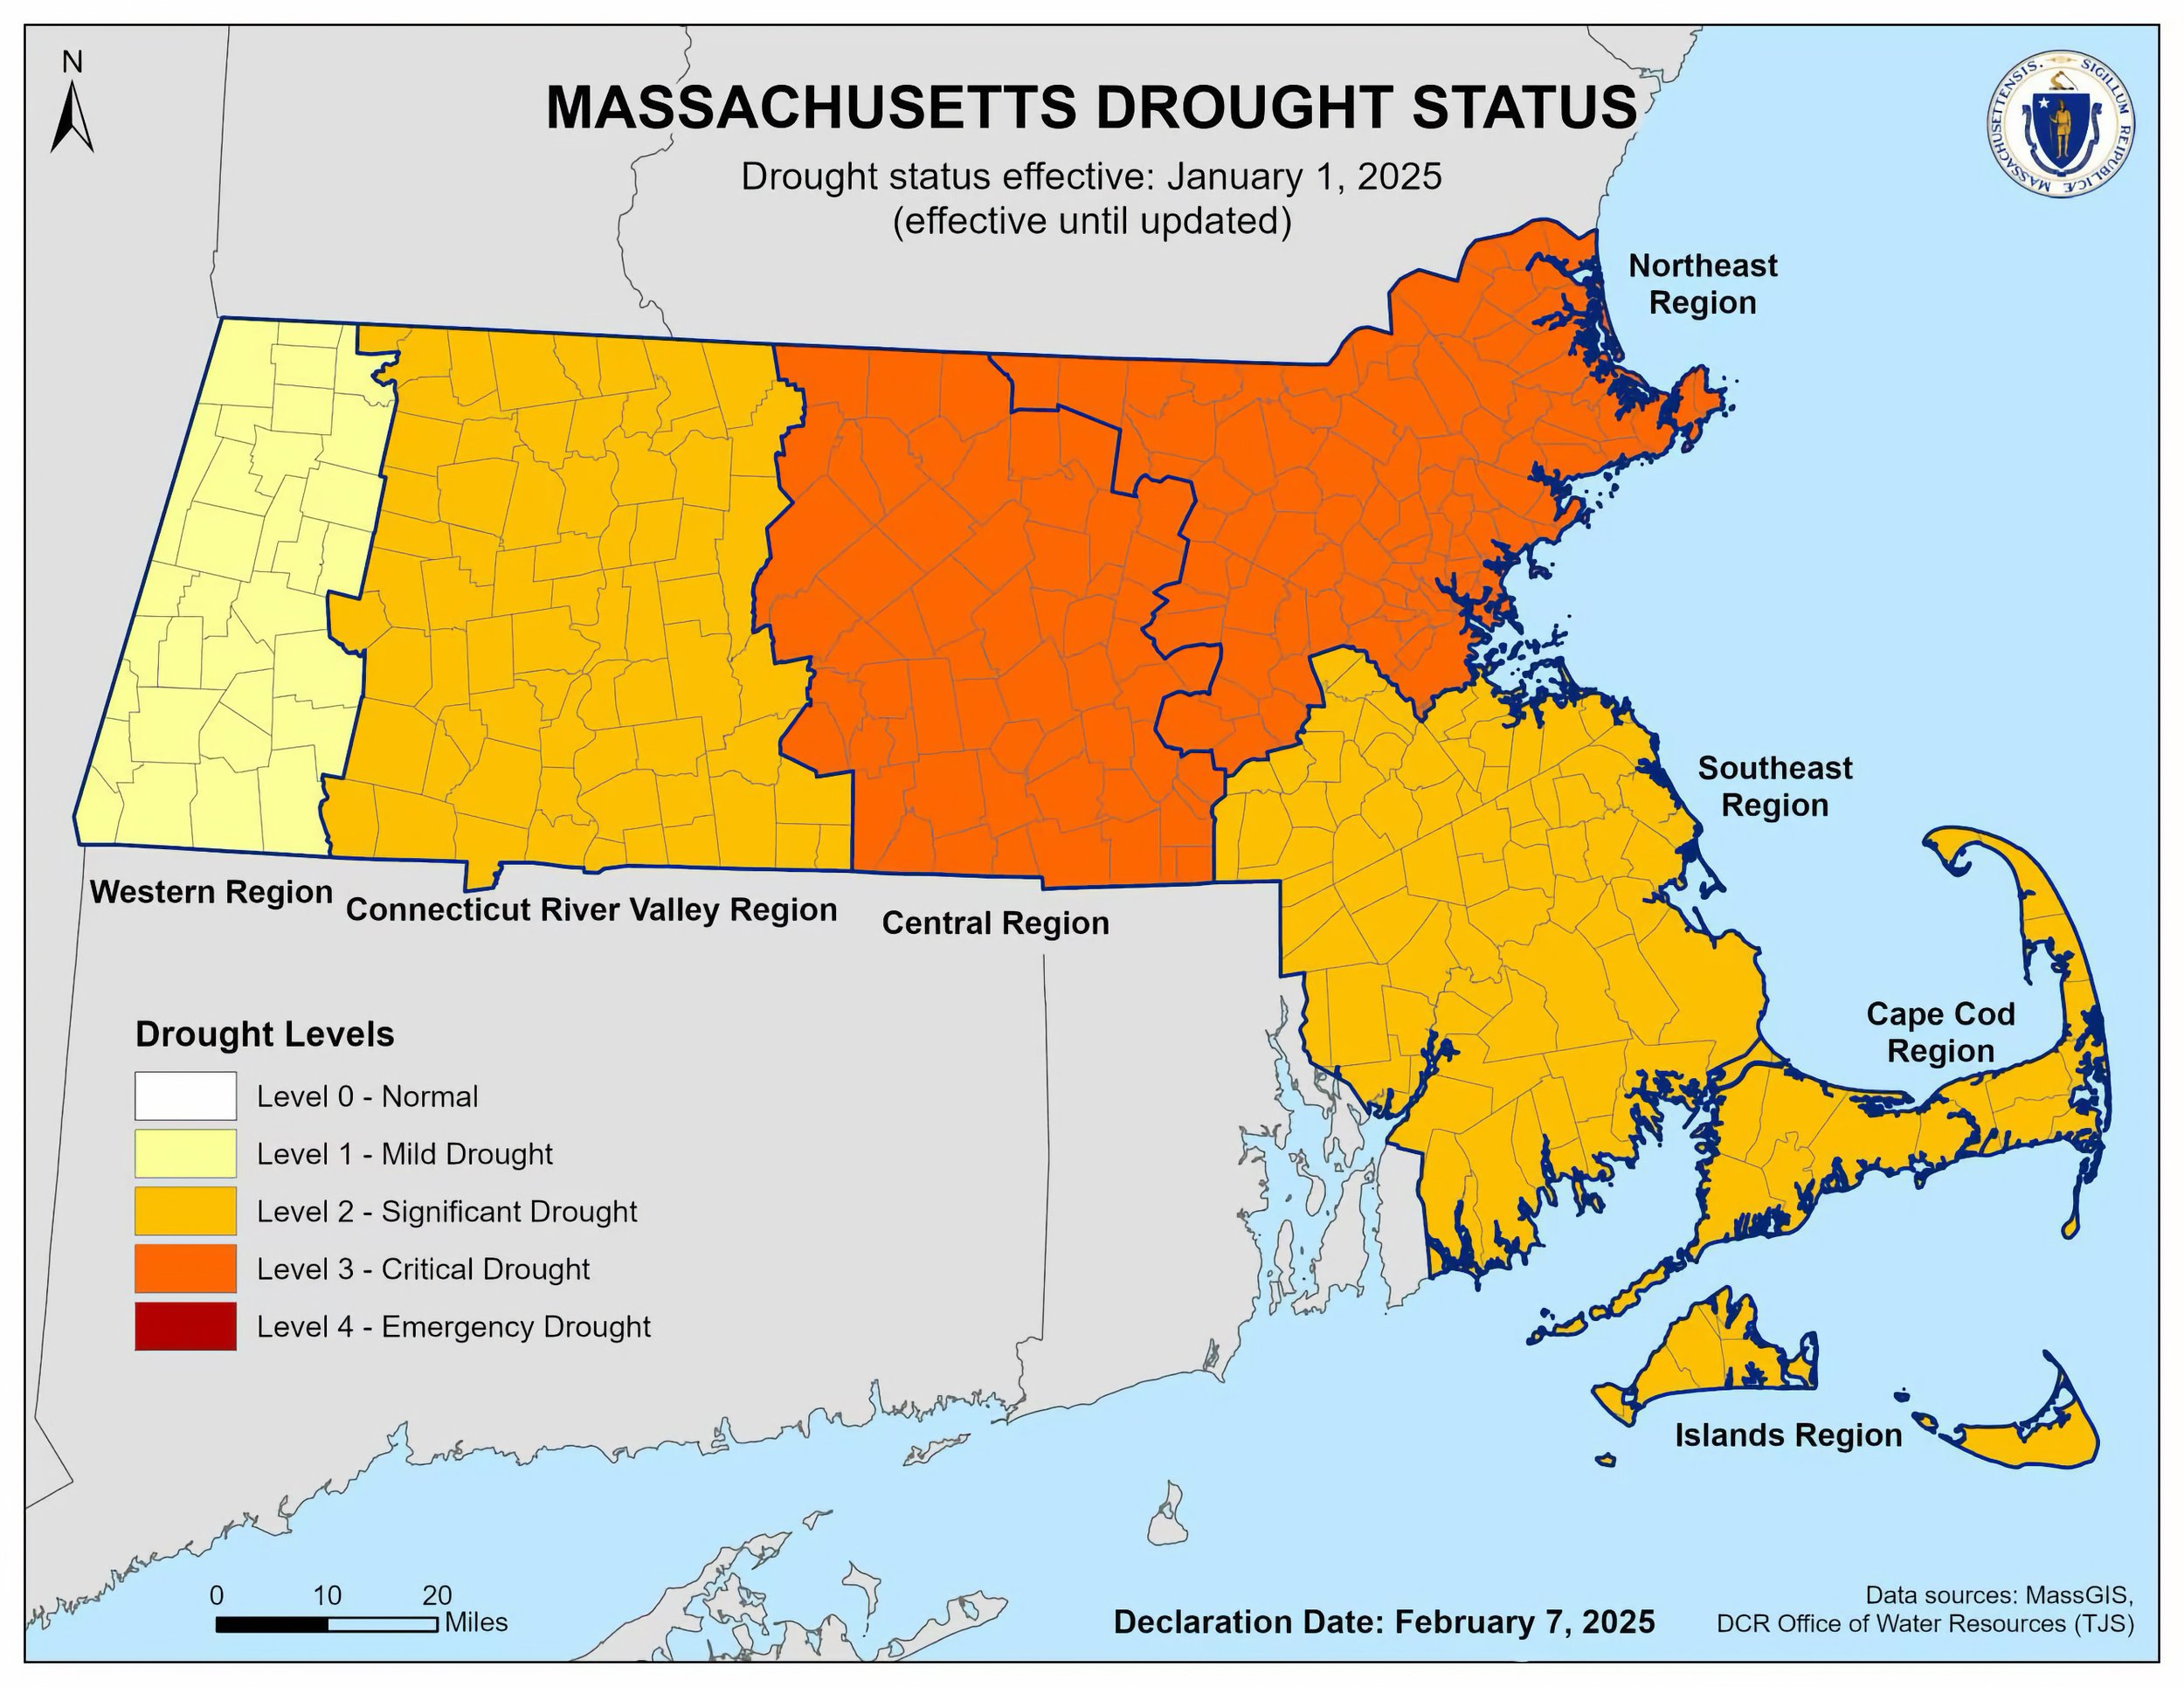
Massachusetts Drought Status declaration on February 7, 2025.
Massachusetts is already in a water crisis—yet the MBTA Communities Act mandates zoning for at least 296,806 new housing units by 2030, less than 5 years from now. Each apartment consumes 35,000 to 50,000 gallons of water annually, adding a staggering 12.6 billion gallons of demand per year (median). The 12.6 billion gallons only accounts for the MBTA Communities Act housing and does not include water demand from other ongoing and future developments. For example, the proposed Rice Pond Village Chapter 40B project in Millbury—a 192-unit apartment complex currently under appeal—cannot be supported with town water until at least 2026, highlighting the already strained water supply. There are probably other cases throughout the Commonwealth of Massachusetts as well.
Where will this water come from? The Commonwealth’s Office of Water Resources has already classified the Central and Northeast Regions as being in a Level 3 Critical Drought. To put this in perspective, the median of 12.6 billion gallons is enough to fill more than 19,000 Olympic-sized swimming pools or submerge Suffolk County under more than a foot of water.
With reservoirs shrinking and droughts intensifying, how can Massachusetts sustain this level of additional water consumption?
For those who want to equate this water volume to counties in Massachusetts, 12.6 billions gallons of water would equate to:
| County | Area (sq mi) | Median Depth (inches) |
|---|---|---|
| Barnstable | 394 | 1.85 inches |
| Berkshire | 946 | 0.77 inches |
| Bristol | 556 | 1.31 inches |
| Dukes | 103 | 7.06 inches |
| Essex | 498 | 1.46 inches |
| Franklin | 702 | 1.04 inches |
| Hampden | 618 | 1.19 inches |
| Hampshire | 545 | 1.34 inches |
| Middlesex | 847 | 0.86 inches |
| Nantucket | 48 | 15.17 inches |
| Norfolk | 400 | 1.82 inches |
| Plymouth | 661 | 1.11 inches |
| Suffolk | 58 | 12.56 inches |
| Worcester | 1,513 | 0.48 inches |
What contingency plans are in place to confront this escalating crisis? How are communities safeguarding their water supply, infrastructure, and residents? In the midst of a severe drought emergency, does it make sense to drastically upzone and push for exponential multi-family growth in 177 communities—half the state? It seems the Executive Office of Housing and Livable Communities (EOHLC) has failed to conduct due diligence, mandating rapid growth without ensuring the necessary infrastructure for life-sustaining water, adequate fire protection, and other critical resources—leaving individual communities to bear the burden and costs. The planners do not appear to be planning and consider all the factors in decisions.
Before proceeding with zoning amendment votes under the MBTA Communities Act, it's imperative that local officials present detailed, actionable contingency plans to residents. These plans should address how communities will manage increased water demand, ensure adequate water pressure for firefighting, and maintain essential infrastructure amid current drought conditions. Transparent communication and thorough planning are essential to align development goals with sustainable resource management.
The Strain on Water Resources
Water is the lifeblood of any community, essential not just for drinking, but for sanitation, cooking, and other daily activities. When a municipality experiences a drastic increase in apartment units without a corresponding increase in water supply, the consequences can be severe.
Overburdened Infrastructure: Municipal water systems are designed based on projected population growth. A sudden spike in apartment construction can overwhelm these systems, leading to reduced water pressure, frequent service interruptions, and a greater risk of contamination. In areas already prone to water scarcity, the impact can be even more pronounced, leading to rationing and restrictions that affect both residents and businesses.
Environmental Degradation: Over-extraction of water to meet the demands of a rapidly growing population can deplete local aquifers, rivers, and lakes, causing long-term damage to ecosystems. This not only threatens local wildlife but can also lead to the collapse of natural water filtration systems, further compromising water quality.
Increased Costs for Municipalities: As water becomes scarcer, the cost of sourcing, treating, and distributing it rises. Municipalities may be forced to invest in expensive infrastructure upgrades or seek alternative water sources, which can strain public budgets and lead to higher taxes or fees for residents.
Public Health Concerns
The health implications of inadequate drinking water are profound. Waterborne diseases, often the result of contaminated or insufficient water supplies, can spread quickly in densely populated areas. Inadequate water availability can also lead to poor sanitation, increasing the risk of outbreaks of illnesses such as cholera, dysentery, and typhoid.
Moreover, when water becomes scarce, people may turn to alternative, often unsafe, sources. This can include drawing water from polluted rivers or lakes, using untreated well water, or relying on bottled water, which may not always meet safety standards.
The Importance of Responsible Development
To prevent these scenarios, it is crucial that municipalities and developers work together to ensure that water infrastructure keeps pace with housing development. This means investing in water conservation measures, upgrading existing infrastructure, and exploring new sources of water, such as desalination or recycled water.
Local governments must also enforce strict zoning laws that take water availability into account when approving new construction projects. This might mean capping the number of new apartments until adequate water resources are secured or requiring developers to contribute to the cost of necessary infrastructure improvements.
Balancing Growth with Water Security
The push for more housing is understandable and necessary, but it must not come at the expense of the very resources that sustain life. Without careful planning and a commitment to sustainable development, the rapid increase in apartment construction can lead to a crisis of water scarcity that threatens public health, the environment, and the long-term viability of our communities.
As residents and advocates, it’s essential to remain vigilant and demand that our leaders prioritize the availability of adequate drinking water in all future development plans. Only by balancing growth with sustainability can we ensure a prosperous future for all.
Not a Hypothetical
Water is the foundation of life and a critical factor in economic growth, yet many regions in the United States face severe water insecurity. From prolonged droughts and groundwater depletion to toxic contamination and failing infrastructure, these challenges are reshaping communities, stalling development, and forcing difficult decisions about the future.
Some places struggle with basic access to clean water, while others are seeing rapidly declining reservoirs or legal battles over dwindling supplies. In the worst cases, water crises have led to population declines, economic stagnation, and even public health disasters.
Here are 10 places in the U.S. where water insecurity is having a profound impact on development—threatening everything from homebuilding and agriculture to public health and economic stability.
1. Navajo Nation (Arizona, New Mexico, Utah)
Issue: Many residents lack access to clean, running water due to infrastructure deficiencies and water rights disputes.
Impact on Development: Severe lack of water access has stalled economic development and homebuilding, exacerbating poverty and health issues.
2. Flint, Michigan
Issue: Lead contamination in the water supply due to inadequate treatment of the Flint River water (2014 crisis).
Impact on Development: Long-term public health crisis, population decline, economic downturn, and significant distrust in public infrastructure. Housing values fell, and new development stagnated due to concerns over water safety.
3. Jackson, Mississippi
Issue: Chronic water infrastructure failures, including lead contamination and treatment plant breakdowns.
Impact on Development: Frequent boil-water advisories, unreliable supply, discouraged investment, and forced relocation of residents.
4. The Colorado River Basin (Southwest U.S.)
States Affected: Arizona, California, Nevada, Utah, Colorado, New Mexico, Wyoming
Issue: Prolonged drought, over-allocation of water rights, and declining reservoir levels (Lake Mead and Lake Powell).
Impact on Development: Restrictions on new home construction in cities like Scottsdale, AZ, and potential cuts to water availability for new developments in Las Vegas, NV.
5. California (Central Valley & Southern California)
Issue: Persistent droughts, over-extraction of groundwater, and reliance on imported water.
Impact on Development: Water shortages have led to restrictions on new housing developments, agricultural losses, and rising water costs.
6. Phoenix & Tucson, Arizona
Issue: Dependence on the dwindling Colorado River and declining groundwater reserves.
Impact on Development: Water scarcity is limiting new housing developments. The state has already put restrictions on groundwater use for new construction in some areas.
7. Ogallala Aquifer Region (Great Plains - Nebraska, Kansas, Oklahoma, Texas)
Issue: Rapid depletion of groundwater used for agriculture and domestic supply.
Impact on Development: Declining water resources are affecting agricultural viability and limiting new residential and industrial development.
8. Atlanta, Georgia (Lake Lanier & Tri-State Water Wars)
Issue: The city’s primary water source, Lake Lanier, is at the center of a decades-long legal dispute between Georgia, Alabama, and Florida over water rights. Droughts and overuse have strained supply.
Impact on Development: Water restrictions and legal uncertainty have affected long-term planning and development in the metro area. A court ruling at one point nearly cut Atlanta off from its primary water source, threatening growth and infrastructure stability.
9. Las Vegas, Nevada
Issue: Reliance on the shrinking Colorado River and Lake Mead.
Impact on Development: The city has implemented strict conservation measures, banned new lawns, and developers must prove water availability before construction.
10. Cape Coral & Lehigh Acres, Florida
Issue: Limited groundwater supply and challenges in securing long-term water resources.
Impact on Development: Developers face water-use restrictions, and new housing projects require expensive infrastructure investments.
This ranking prioritizes severity based on immediate humanitarian crises, long-term sustainability threats, and legal/infrastructure uncertainties affecting development.
Local and state leaders must provide clear and definitive answers before any zoning amendment votes take place. Without concrete solutions, registered voters should oppose the MBTA Communities Act. Knowledge is power—without clear answers, informed decision-making is impossible.
Water is just one piece of the infrastructure puzzle. Sewer and wastewater treatment capacity, the strain on power grids from additional housing units, and the transition to an all-electric society all require careful planning and investment to support sustainable growth. Growth needs to be responsible and sustainable while being carefully balanced. All the pieces must be in place before exponential growth can occur responsibility and sustainability.
By The Numbers
| Community | Minimum Unit Capacity | Additional Gallons Per Year |
|---|---|---|
| Abington | 1,022 | 35,770,000 to 51,100,000 |
| Acton | 1,383 | 48,405,000 to 69,150,000 |
| Amesbury | 789 | 27,615,000 to 39,450,000 |
| Andover | 2,031 | 71,085,000 to 101,550,000 |
| Arlington | 2,046 | 71,610,000 to 102,300,000 |
| Ashburnham | 137 | 4,795,000 to 6,850,000 |
| Ashby | 62 | 2,170,000 to 3,100,000 |
| Ashland | 1,124 | 39,340,000 to 56,200,000 |
| Attleboro | 2,865 | 100,275,000 to 143,250,000 |
| Auburn | 750 | 26,250,000 to 37,500,000 |
| Ayer | 750 | 26,250,000 to 37,500,000 |
| Bedford | 750 | 26,250,000 to 37,500,000 |
| Bellingham | 750 | 26,250,000 to 37,500,000 |
| Belmont | 1,632 | 57,120,000 to 81,600,000 |
| Berkley | 118 | 4,130,000 to 5,900,000 |
| Beverly | 2,683 | 93,905,000 to 134,150,000 |
| Billerica | 2,323 | 81,305,000 to 116,150,000 |
| Bourne | 557 | 19,495,000 to 27,850,000 |
| Boxborough | 118 | 4,130,000 to 5,900,000 |
| Boxford | 141 | 4,935,000 to 7,050,000 |
| Braintree | 3,769 | 131,915,000 to 188,450,000 |
| Bridgewater | 1,401 | 49,035,000 to 70,050,000 |
| Brockton | 5,596 | 195,860,000 to 279,800,000 |
| Brookline | 6,990 | 244,650,000 to 349,500,000 |
| Burlington | 1,043 | 36,505,000 to 52,150,000 |
| Cambridge | 13,477 | 471,695,000 to 673,850,000 |
| Canton | 1,490 | 52,150,000 to 74,500,000 |
| Carlisle | 95 | 3,325,000 to 4,750,000 |
| Carver | 235 | 8,225,000 to 11,750,000 |
| Chelmsford | 1,477 | 51,695,000 to 73,850,000 |
| Chelsea | 3,639 | 127,365,000 to 181,950,000 |
| Cohasset | 638 | 22,330,000 to 31,900,000 |
| Concord | 1,094 | 38,290,000 to 54,700,000 |
| Danvers | 1,176 | 41,160,000 to 58,800,000 |
| Dedham | 1,569 | 54,915,000 to 78,450,000 |
| Dover | 102 | 3,570,000 to 5,100,000 |
| Dracut | 1,233 | 43,155,000 to 61,650,000 |
| Duxbury | 750 | 26,250,000 to 37,500,000 |
| East Bridgewater | 750 | 26,250,000 to 37,500,000 |
| Easton | 913 | 31,955,000 to 45,650,000 |
| Essex | 83 | 2,905,000 to 4,150,000 |
| Everett | 4,552 | 159,320,000 to 227,600,000 |
| Fall River | 6,652 | 232,820,000 to 332,600,000 |
| Fitchburg | 2,618 | 91,630,000 to 130,900,000 |
| Foxborough | 768 | 26,880,000 to 38,400,000 |
| Framingham | 4,355 | 152,425,000 to 217,750,000 |
| Franklin | 1,883 | 65,905,000 to 94,150,000 |
| Freetown | 750 | 26,250,000 to 37,500,000 |
| Georgetown | 750 | 26,250,000 to 37,500,000 |
| Gloucester | 2,270 | 79,450,000 to 113,500,000 |
| Grafton | 776 | 27,160,000 to 38,800,000 |
| Groton | 208 | 7,280,000 to 10,400,000 |
| Groveland | 130 | 4,550,000 to 6,500,000 |
| Halifax | 750 | 26,250,000 to 37,500,000 |
| Hamilton | 731 | 25,585,000 to 36,550,000 |
| Hanover | 750 | 26,250,000 to 37,500,000 |
| Hanson | 750 | 26,250,000 to 37,500,000 |
| Harvard | 113 | 3,955,000 to 5,650,000 |
| Haverhill | 4,189 | 146,615,000 to 209,450,000 |
| Hingham | 1,490 | 52,150,000 to 74,500,000 |
| Holbrook | 662 | 23,170,000 to 33,100,000 |
| Holden | 750 | 26,250,000 to 37,500,000 |
| Holliston | 750 | 26,250,000 to 37,500,000 |
| Hopkinton | 750 | 26,250,000 to 37,500,000 |
| Hull | 586 | 20,510,000 to 29,300,000 |
| Ipswich | 971 | 33,985,000 to 48,550,000 |
| Kingston | 805 | 28,175,000 to 40,250,000 |
| Lakeville | 231 | 8,085,000 to 11,550,000 |
| Lancaster | 139 | 4,865,000 to 6,950,000 |
| Lawrence | 4,501 | 157,535,000 to 225,050,000 |
| Leicester | 219 | 7,665,000 to 10,950,000 |
| Leominster | 2,810 | 98,350,000 to 140,500,000 |
| Lexington | 1,231 | 43,085,000 to 61,550,000 |
| Lincoln | 635 | 22,225,000 to 31,750,000 |
| Littleton | 750 | 26,250,000 to 37,500,000 |
| Lowell | 6,522 | 228,270,000 to 326,100,000 |
| Lunenburg | 240 | 8,400,000 to 12,000,000 |
| Lynn | 5,517 | 193,095,000 to 275,850,000 |
| Lynnfield | 607 | 21,245,000 to 30,350,000 |
| Malden | 6,930 | 242,550,000 to 346,500,000 |
| Manchester-by-the-Sea | 559 | 19,565,000 to 27,950,000 |
| Mansfield | 1,392 | 48,720,000 to 69,600,000 |
| Marblehead | 897 | 31,395,000 to 44,850,000 |
| Marlborough | 1,755 | 61,425,000 to 87,750,000 |
| Marshfield | 1,158 | 40,530,000 to 57,900,000 |
| Maynard | 474 | 16,590,000 to 23,700,000 |
| Medfield | 750 | 26,250,000 to 37,500,000 |
| Medford | 6,443 | 225,505,000 to 322,150,000 |
| Medway | 750 | 26,250,000 to 37,500,000 |
| Melrose | 1,892 | 66,220,000 to 94,600,000 |
| Merrimac | 138 | 4,830,000 to 6,900,000 |
| Methuen | 2,019 | 70,665,000 to 100,950,000 |
| Middleborough | 1,471 | 51,485,000 to 73,550,000 |
| Middleton | 750 | 26,250,000 to 37,500,000 |
| Millbury | 750 | 26,250,000 to 37,500,000 |
| Millis | 750 | 26,250,000 to 37,500,000 |
| Milton | 2,461 | 86,135,000 to 123,050,000 |
| Nahant | 84 | 2,940,000 to 4,200,000 |
| Natick | 2,352 | 82,320,000 to 117,600,000 |
| Needham | 1,784 | 62,440,000 to 89,200,000 |
| New Bedford | 6,688 | 234,080,000 to 334,400,000 |
| Newbury | 154 | 5,390,000 to 7,700,000 |
| Newburyport | 1,292 | 45,220,000 to 64,600,000 |
| Newton | 8,330 | 291,550,000 to 416,500,000 |
| Norfolk | 750 | 26,250,000 to 37,500,000 |
| North Andover | 1,191 | 41,685,000 to 59,550,000 |
| North Attleborough | 1,255 | 43,925,000 to 62,750,000 |
| North Reading | 750 | 26,250,000 to 37,500,000 |
| Northborough | 750 | 26,250,000 to 37,500,000 |
| Northbridge | 750 | 26,250,000 to 37,500,000 |
| Norton | 750 | 26,250,000 to 37,500,000 |
| Norwell | 750 | 26,250,000 to 37,500,000 |
| Norwood | 2,045 | 71,575,000 to 102,250,000 |
| Paxton | 84 | 2,940,000 to 4,200,000 |
| Peabody | 2,319 | 81,165,000 to 115,950,000 |
| Pembroke | 750 | 26,250,000 to 37,500,000 |
| Plymouth | 2,807 | 98,245,000 to 140,350,000 |
| Plympton | 53 | 1,855,000 to 2,650,000 |
| Princeton | 69 | 2,415,000 to 3,450,000 |
| Quincy | 11,752 | 411,320,000 to 587,600,000 |
| Randolph | 1,935 | 67,725,000 to 96,750,000 |
| Raynham | 750 | 26,250,000 to 37,500,000 |
| Reading | 1,493 | 52,255,000 to 74,650,000 |
| Rehoboth | 231 | 8,085,000 to 11,550,000 |
| Revere | 6,135 | 214,725,000 to 306,750,000 |
| Rochester | 105 | 3,675,000 to 5,250,000 |
| Rockland | 726 | 25,410,000 to 36,300,000 |
| Rockport | 657 | 22,995,000 to 32,850,000 |
| Rowley | 601 | 21,035,000 to 30,050,000 |
| Salem | 3,052 | 106,820,000 to 152,600,000 |
| Salisbury | 750 | 26,250,000 to 37,500,000 |
| Saugus | 1,130 | 39,550,000 to 56,500,000 |
| Scituate | 1,239 | 43,365,000 to 61,950,000 |
| Seekonk | 750 | 26,250,000 to 37,500,000 |
| Sharon | 987 | 34,545,000 to 49,350,000 |
| Sherborn | 78 | 2,730,000 to 3,900,000 |
| Shirley | 650 | 22,750,000 to 32,500,000 |
| Shrewsbury | 1,497 | 52,395,000 to 74,850,000 |
| Somerville | 9,067 | 317,345,000 to 453,350,000 |
| Southborough | 750 | 26,250,000 to 37,500,000 |
| Sterling | 156 | 5,460,000 to 7,800,000 |
| Stoneham | 1,016 | 35,560,000 to 50,800,000 |
| Stoughton | 1,761 | 61,635,000 to 88,050,000 |
| Stow | 139 | 4,865,000 to 6,950,000 |
| Sudbury | 750 | 26,250,000 to 37,500,000 |
| Sutton | 181 | 6,335,000 to 9,050,000 |
| Swampscott | 954 | 33,390,000 to 47,700,000 |
| Taunton | 3,745 | 131,075,000 to 187,250,000 |
| Tewksbury | 1,214 | 42,490,000 to 60,700,000 |
| Topsfield | 118 | 4,130,000 to 5,900,000 |
| Townsend | 178 | 6,230,000 to 8,900,000 |
| Tyngsborough | 750 | 26,250,000 to 37,500,000 |
| Upton | 150 | 5,250,000 to 7,500,000 |
| Wakefield | 1,696 | 59,360,000 to 84,800,000 |
| Walpole | 1,506 | 52,710,000 to 75,300,000 |
| Waltham | 3,982 | 139,370,000 to 199,100,000 |
| Wareham | 1,297 | 45,395,000 to 64,850,000 |
| Watertown | 1,701 | 59,535,000 to 85,050,000 |
| Wayland | 750 | 26,250,000 to 37,500,000 |
| Wellesley | 1,392 | 48,720,000 to 69,600,000 |
| Wenham | 365 | 12,775,000 to 18,250,000 |
| West Boylston | 587 | 20,545,000 to 29,350,000 |
| West Bridgewater | 145 | 5,075,000 to 7,250,000 |
| West Newbury | 87 | 3,045,000 to 4,350,000 |
| Westborough | 1,250 | 43,750,000 to 62,500,000 |
| Westford | 924 | 32,340,000 to 46,200,000 |
| Westminster | 165 | 5,775,000 to 8,250,000 |
| Weston | 750 | 26,250,000 to 37,500,000 |
| Westwood | 870 | 30,450,000 to 43,500,000 |
| Weymouth | 3,813 | 133,455,000 to 190,650,000 |
| Whitman | 898 | 31,430,000 to 44,900,000 |
| Wilmington | 1,248 | 43,680,000 to 62,400,000 |
| Winchester | 1,220 | 42,700,000 to 61,000,000 |
| Winthrop | 882 | 30,870,000 to 44,100,000 |
| Woburn | 2,631 | 92,085,000 to 131,550,000 |
| Worcester | 12,642 | 442,470,000 to 632,100,000 |
| Wrentham | 750 | 26,250,000 to 37,500,000 |
| Total | 296,806 | 10,388,210,000 to 14,840,300,000 |
Bringing a New Public Well Online
Bringing a new municipal domestic water well online in Massachusetts is a multi-step process that typically takes several years due to regulatory approvals, hydrogeologic studies, design, and construction. The general timeline can range from 3 to 7 years, depending on factors such as site conditions, permitting complexity, and potential public opposition. Here’s an overview of the process:
1. Feasibility & Site Selection (6 months – 2 years)
Conduct hydrogeologic studies to determine water availability and quality.
Identify potential well sites based on local aquifers and land use restrictions.
Perform test drilling and preliminary pump tests.
Engage with local and state regulators.
2. Permitting & Approvals (1 – 3 years)
File an application with the Massachusetts Department of Environmental Protection (MassDEP).
Conduct an environmental impact assessment, including water quality testing.
Comply with the Massachusetts Water Management Act if the well exceeds withdrawal thresholds.
Obtain approvals from the local Conservation Commission, Planning Board, and possibly MEPA (Massachusetts Environmental Policy Act) review.
Secure necessary zoning and land-use permits.
3. Well Design & Infrastructure Planning (6 months – 2 years)
Design the well, pump station, and distribution system.
Obtain approval for water treatment plans if needed.
Conduct a pump test and safe yield analysis to ensure sustainable water withdrawal.
4. Construction & Installation (6 months – 1.5 years)
Drill and develop the well.
Install pumps, piping, and water treatment systems.
Connect the well to the municipal water system.
5. Final Testing & MassDEP Approval (6 months – 1 year)
Perform final water quality testing.
Ensure compliance with the Massachusetts Drinking Water Regulations (310 CMR 22.00).
Receive final approval from MassDEP before the well goes into service.
Potential Delays
Environmental concerns (e.g., wetlands, endangered species).
Public opposition (especially if located near residential areas).
Funding and budgeting constraints.
Unexpected geological challenges.